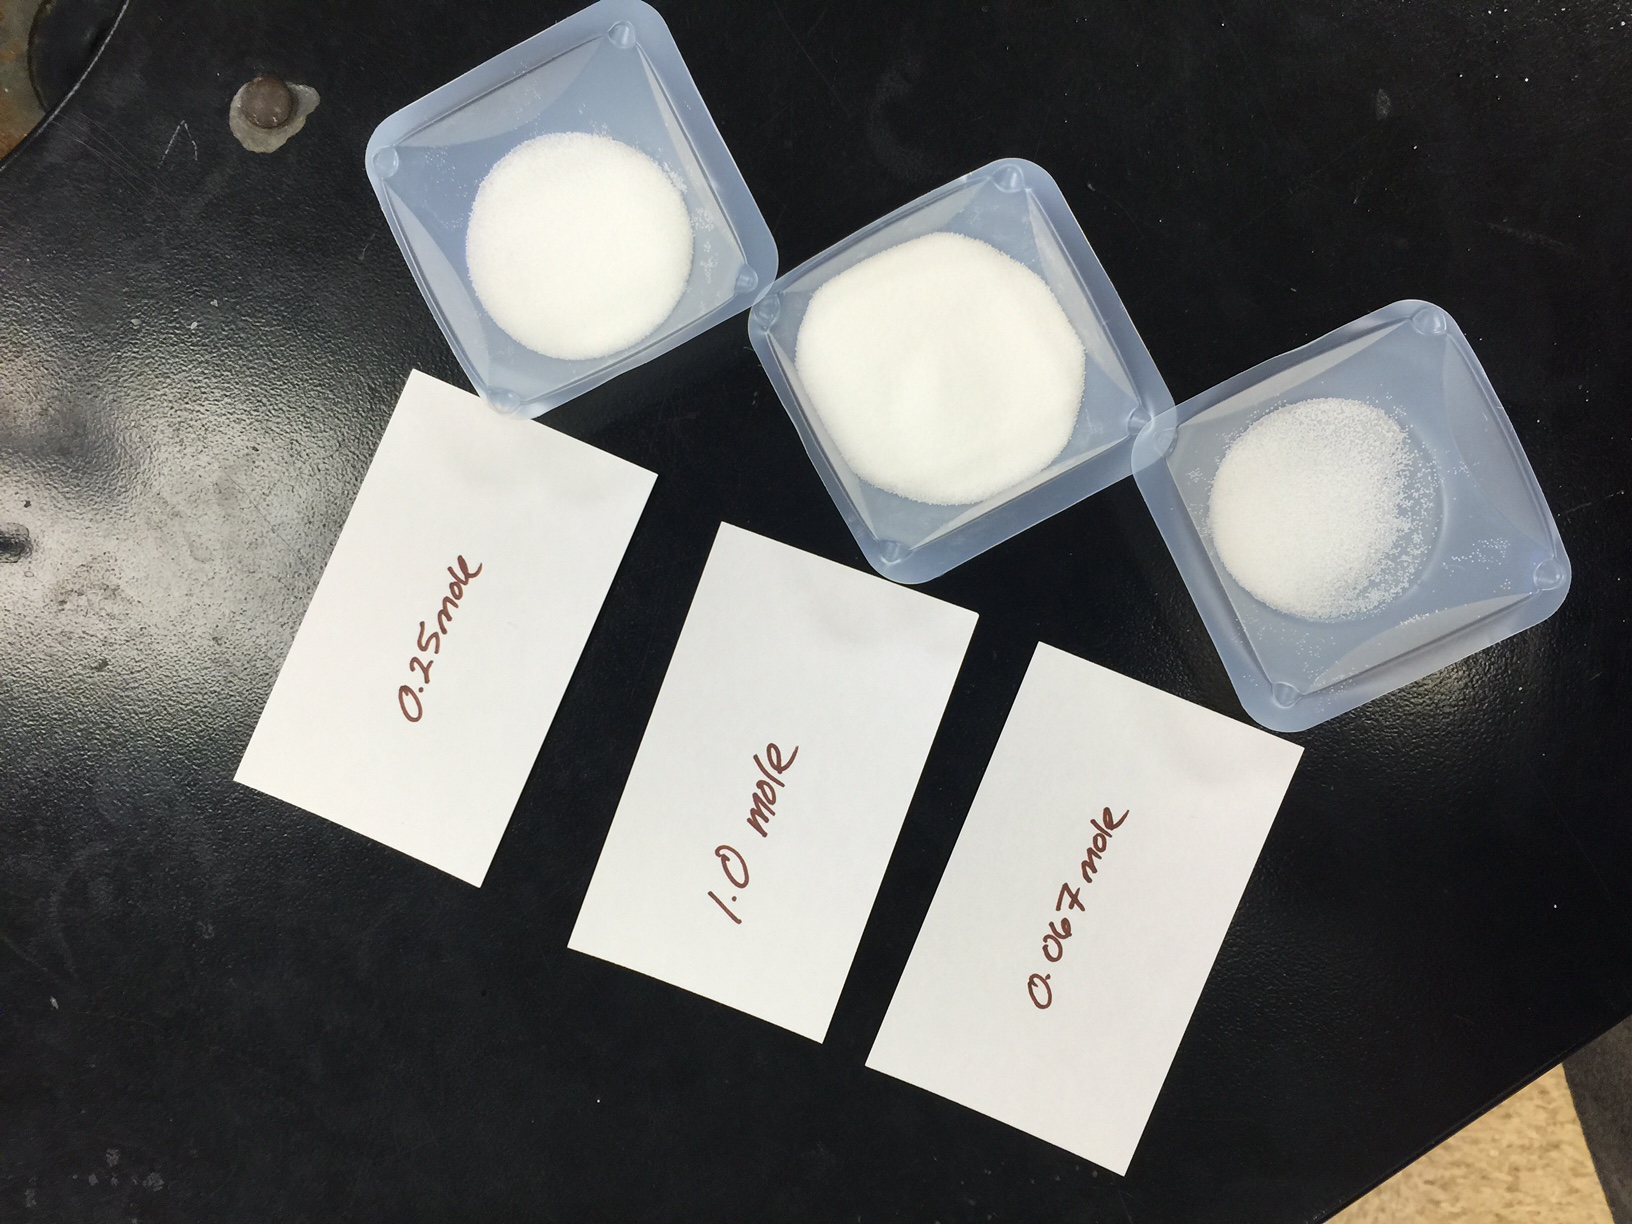
What’s in a mole? 6.022 EE 23 atoms/molecules for sure, but what does a mole look like? That depends on the molar mass of a given compound. The goal of generating this particular activity was to have students calculate the molar mass of three common household compounds, sugar, baking soda and sodium chloride, and then to measure out the same number of moles of each compound and visually compare the amounts of each compound to see how much space a given amount of moles occupies.
The students were open to calculating the molar masses of the compounds, but had initial troubles converting the given number of moles to grams. This may have stemmed from the fact that each lab group was given two values of mole cards to be used to calculate two different sets of calculations, and they were uncertain when to apply which number.
Overall, student feedback was positive with comments noting how much space sugar (mm= 342.30 g/mol) occupied, versus sodium bicarbonate (mm =84.07 g/mol). The origin of this activity stemmed from myself graduating with a degree in chemistry, without ever measuring a single mole of a compound or really knowing what a mole looked like.
InTASC standards 4-5-6-7-8 were all addressed during this activity, as I took content information, designed how to present it, apply it, and assess it. Multiple HLPs were also utilized in this laboratory lesson, including HLP 1-2-3 which focus on planning instruction based on content standards, 6, which easily lends itself to lab work, and 13-14 that cover planning for instruction.
I marvel at the process of planning new activity to lab, particularly how it morphs from start to finish. It took me several hours worth of writing, then editing by Mr. Smith, before we presented it to the class to perform. Even then, from the first period to the next, I had to edit the data table to make it more user friendly.