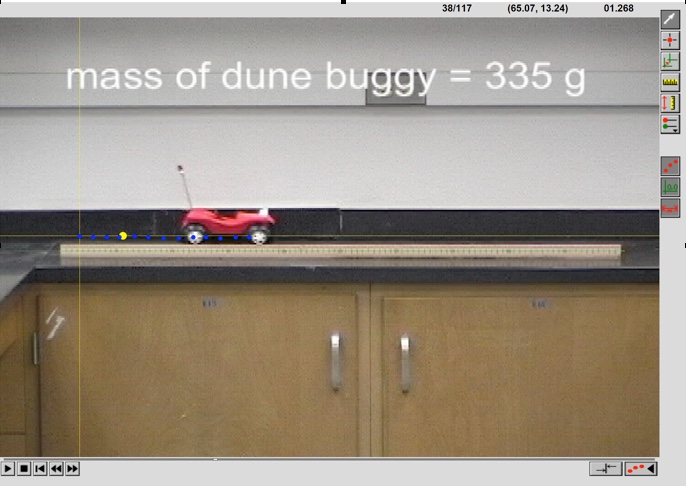
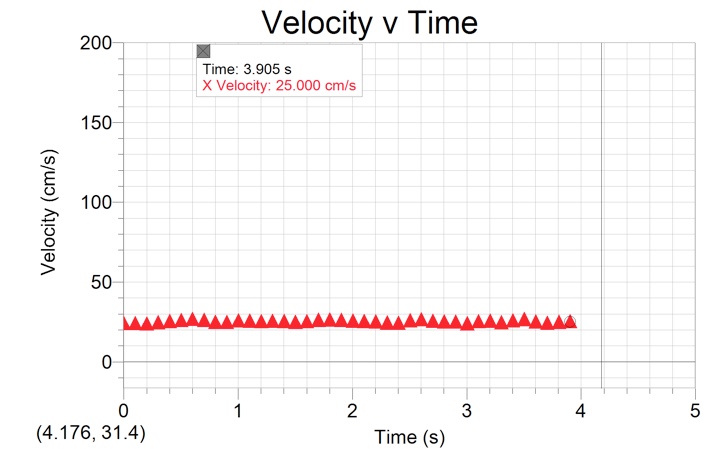
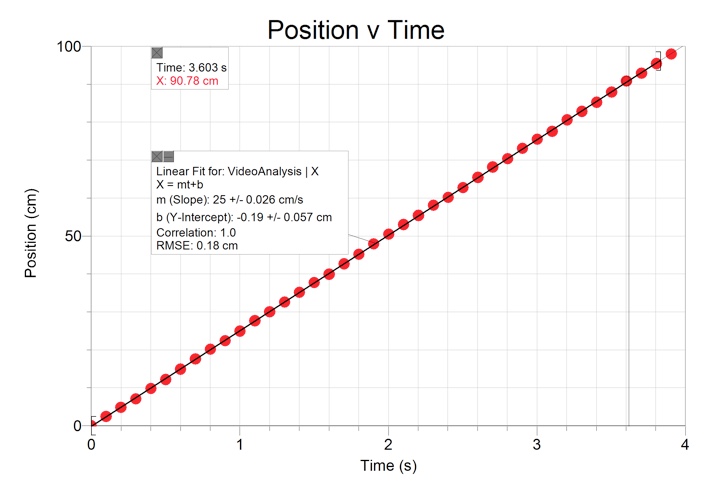
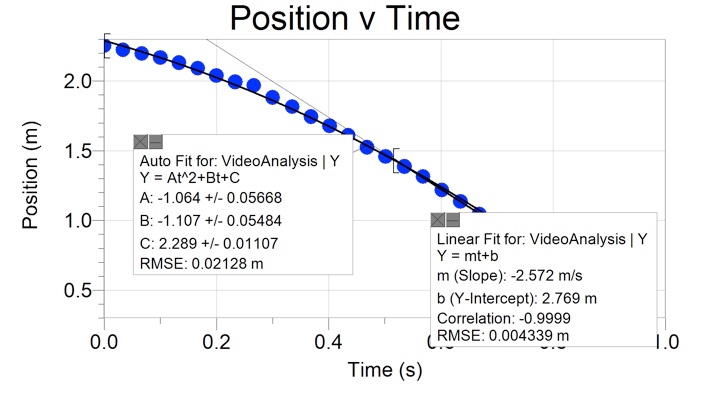
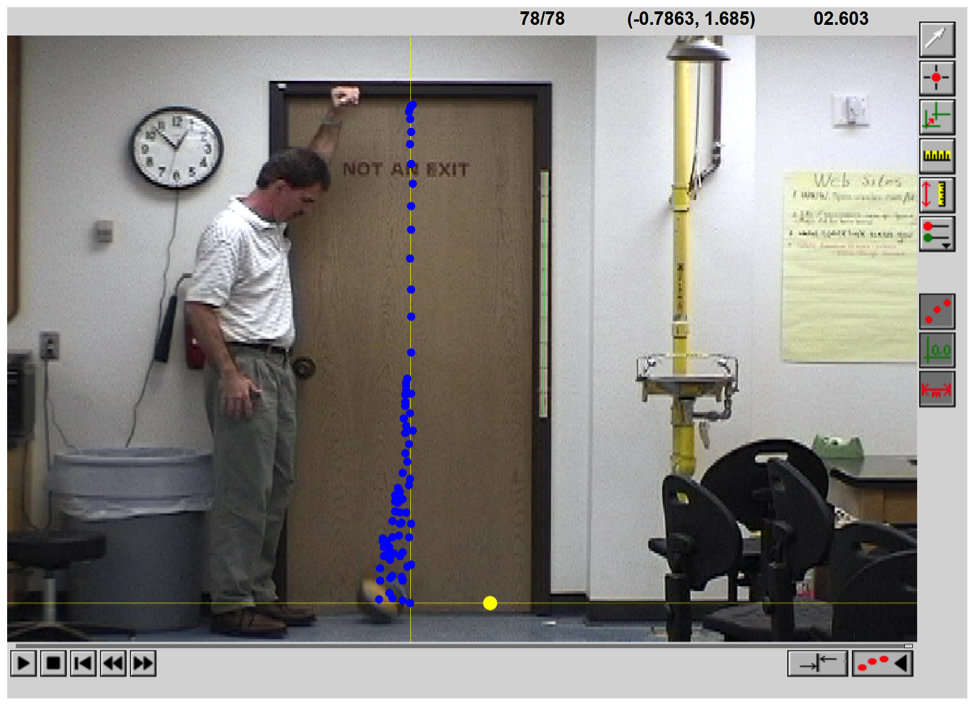
We used the video analysis component of Vernier’s LoggerPro3 software to collect data from both a constant motion vehicle. The video was advanced frame by frame and data points were selected. A scale was then set using the meter stick in the image. From here LoggerPro’s spreadsheet program was used for analysis. Results included:
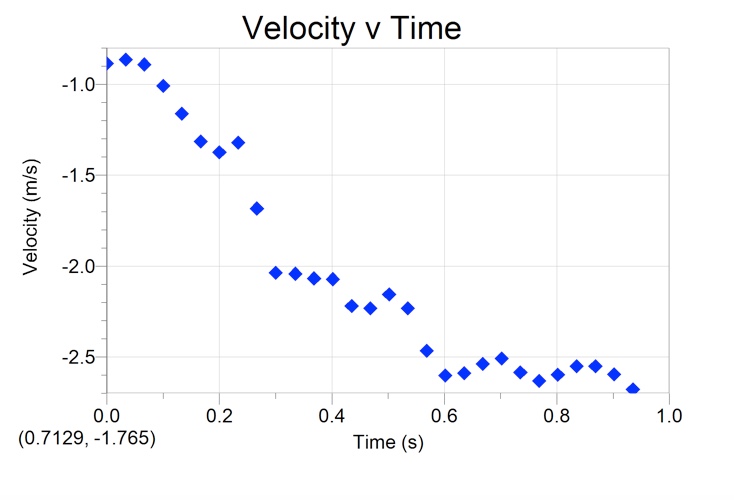
We used the program a second time for analyzing a free fall event in the physics methods course. The data regressions and equations generated were as follows:
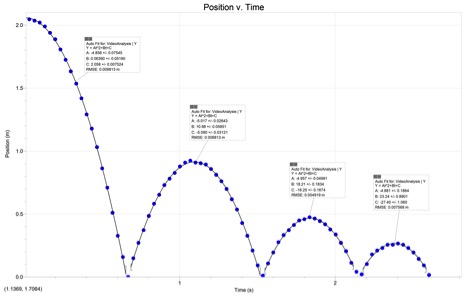
One advantage of using the LoggerPro3 software is that it is able to perform regressions for each individual curve of a data set. This graph is also a physical representation to students that each bounce of the basketball rebounds less each time.
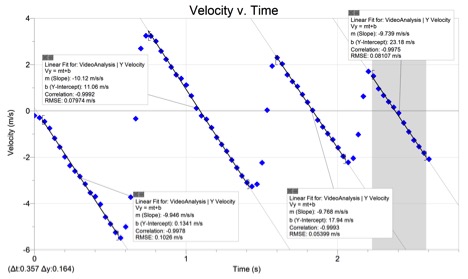
Four linear equations were then obtained from velocity graphs for each rebound. These graphs show students negative velocities and where slope is the acceleration.
We then added a data table to calculate acceleration, potential and kinetic energies:
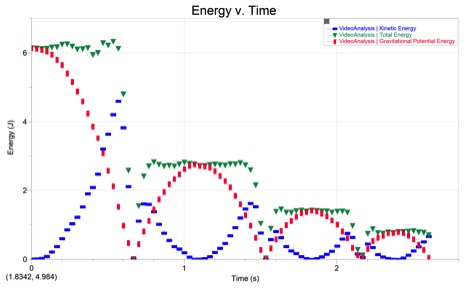
Total energy of each bounce (potential + kinetic) may be seen here as the horizontal green line, as a visual to students that total energy of a bounce remains the same during an event.
The ease of making and importing a video such as these for use by students who follow the same procedures as we did make this a very valuable tool have available in my future classroom. I like that LoggerPro uses technology in a thoughtful, seamless way, without it screaming in your face, “LOOK, YOU’RE USING TECHNOLOGY, PEOPLE!” The low cost and ease of use make it attractive, as well. It is also a great way to graphically represent events to students who may need a graphical representation to better understand a concept.
This artifact best aligns with InTASC 8 by building meaningful knowledge with a varied technique by using probe ware to obtain and analyze data. It also utilizes HLP 1 by making content explicit using modeling and representations.