Below is my Teacher Data Dashboard connected to InTASC 6, created for EDPSY 699. My Dashboard is an interactive spreadsheet, designed for simple data entry use that yields instant computational responses and graphical representations, both across an entire class as well as for individual students.
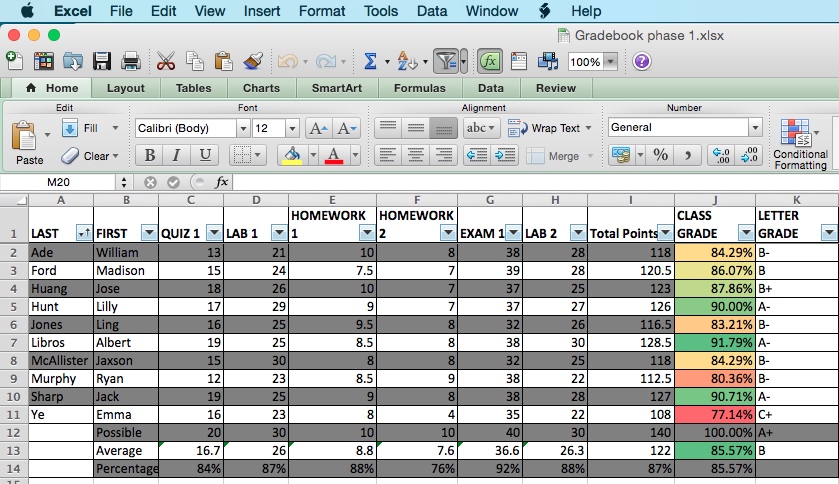
The main sheet is the data entry point and displays all areas of assessment for a class, as well as student information and tabulated grades. Raw scores are converted to percentages and using conditional formatting, given a corresponding letter grade. The letter grades are graphically displayed, using both a color coded warning system (green-yellow-red) as to visually identify performance.
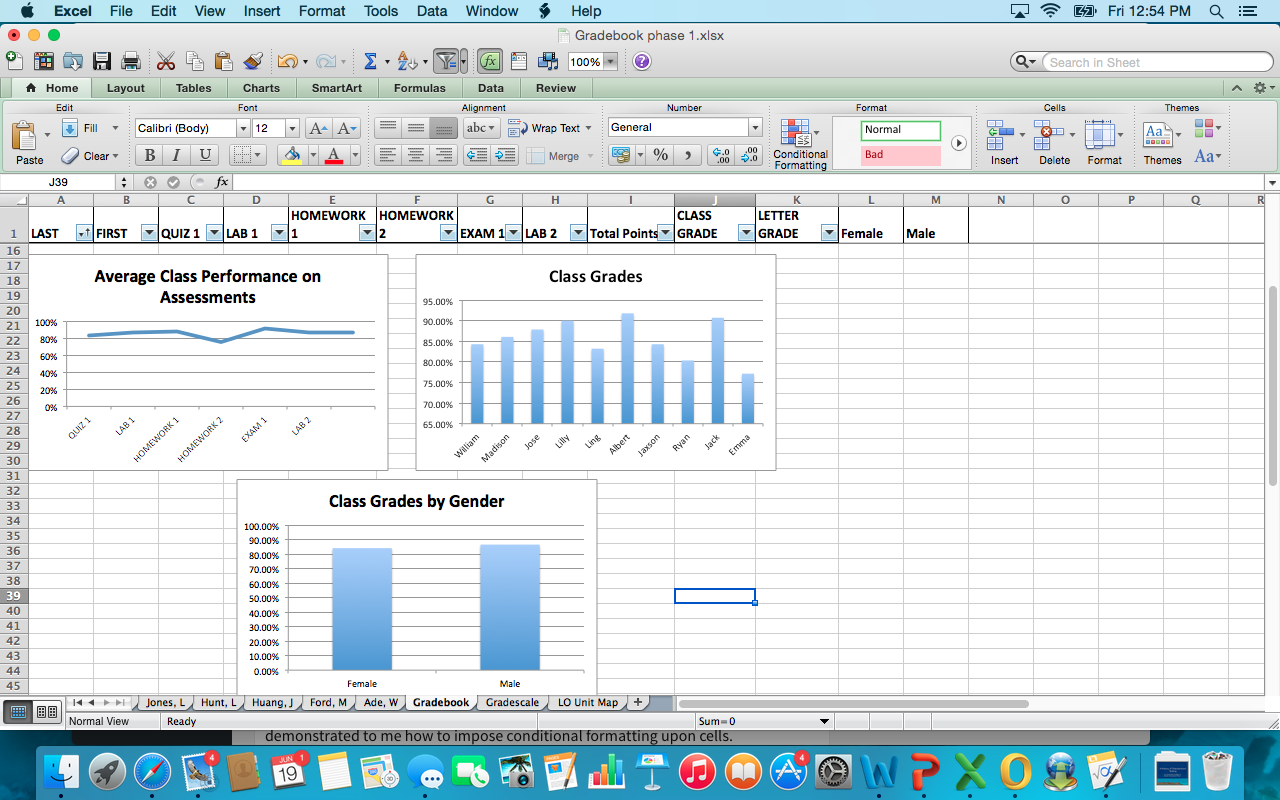
Bar graphs of whole class cumulative scores and gender grade distribution were then generated using the data from the grade book:
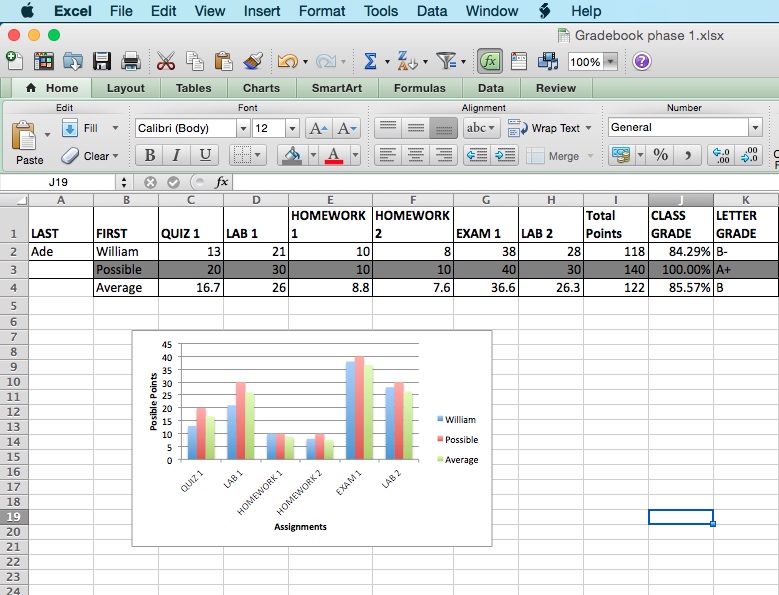
Individual student sheets are contained within the spreadsheet show student performance privately, but with a graphical class comparison:
I like that I could design the spreadsheet to yield data that I found most useful. It is a multifunctional, adaptable tool that helps to better organize the mass of assessment data generated in a classroom. I feel that the data dashboard utilizes HLP 14 by tracking student data and using it to drive teaching decisions. These skills are at the essence of being a modern teacher, and help for reflection as well as reteaching. HLP 17 could be employed here when showing individual sheets to a parent or student.
It has been over a decade since I routinely used Microsoft Excel, but Thomas S. was especially helpful in updating my knowledge as to its use, and Nathan C. demonstrated to me how to impose conditional formatting upon cells.